
administrator
Documentation on pdf
Below are brief instructions and examples how to use IT2 Log Analytics for RAW logs search.
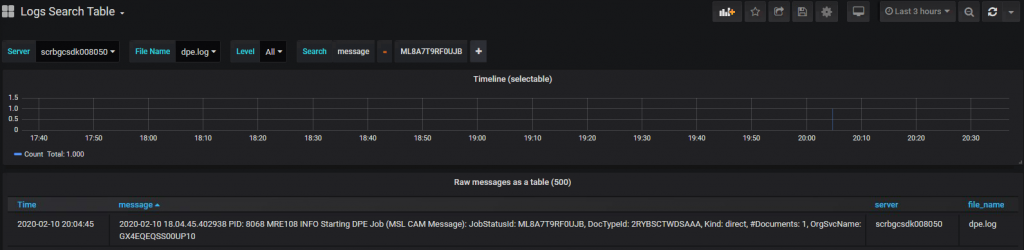
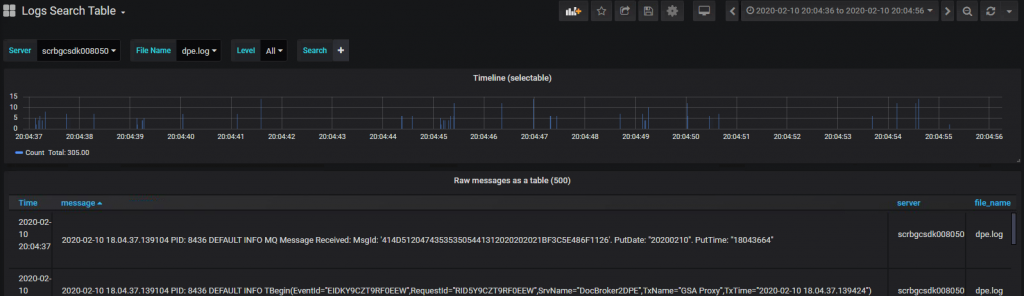
This dashboard offers a table view of raw log records. To quickly narrow the scope of records, one can use filters and time range.
The following Filters are available out of the box:
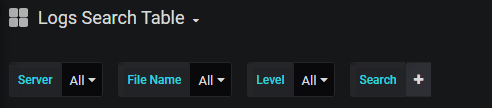
Server, File Name, and Level filters are based on field enrichment by IT2 Log Analytics during logs ingestion process. Filter usage is intuitive – click on the drop-down and choose one of the available options. Options are generated based on records available once previous filters and timeframe are applied. For example:
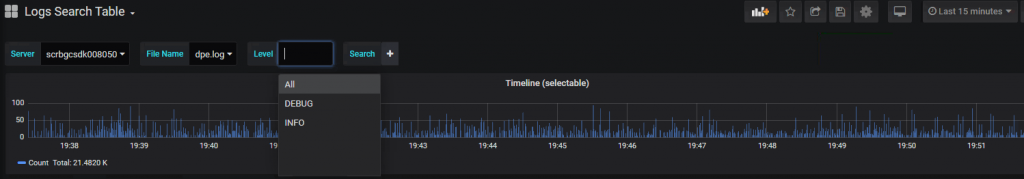
Note: If needed, extra drop-down Filters can be configured by request – for example, User, etc.
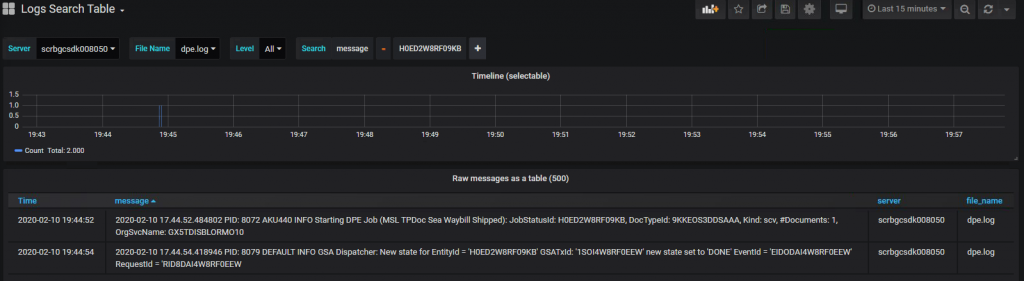
There is also a Search Filter that allows searching of words of phrases in records available once drop-down filters and timeframe are applied. The event itself is stored in the message field, so it is the best candidate for such ad-hoc searches.
1.An example of a single word search (an ID):
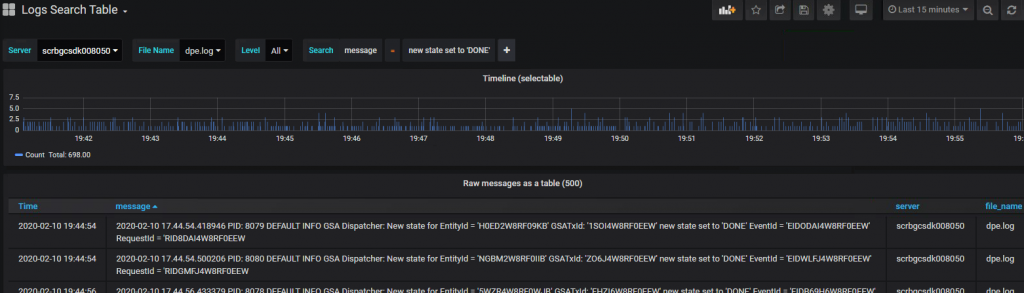
2. An example of a phrase search:
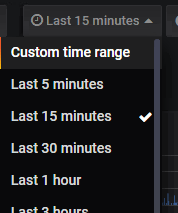
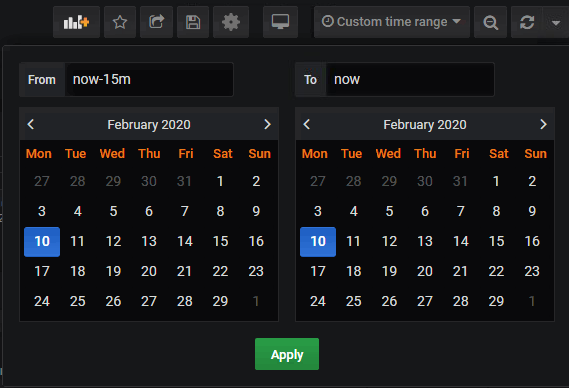
Another option to narrow the search is Time Range. Setting Time Range can be done either with Time Picker in upper right corner or Timeline Panel,
Time Picker offers:
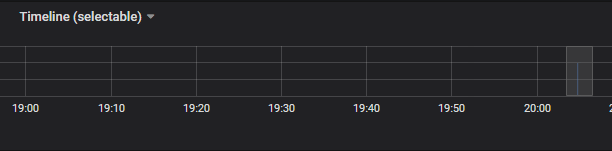
One the other hand, the Timeline Panel allows visual time range selection. This can be useful when after all the filters, only 1 or 2 records were found, and you would like to check other records around them.
For example:
1.Start with the ID search.
2.Click and hold the left mouse button to select the time range around your result. Once you are done, release the button.
3.Clear Search filter.

4.See the results.
5.If needed, farther narrow the time range.
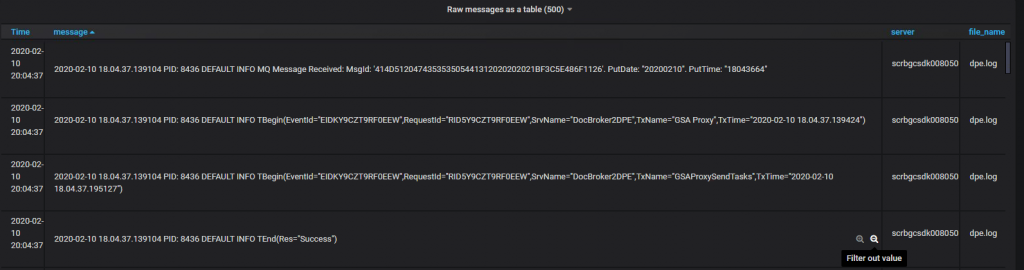
Once all the Filters and Time Range are applied, results can be seen in a table. By default, the first 500 records are displayed (configurable by request). Server and File Name columns are available to reference (can be useful if corresponding filters are set to All). You can click on any column to change the sort direction.
If something has caught your eye, you can copy a word or phrase and paste it into the search filter. Another option is clicking on a cell, move the mouse pointer to the lower right corner, and choose either “Filter for value” or “Filter out value” option (and edit afterward, if needed).
Note: If needed, extra columns can be configured by request – for example, Level column, etc.
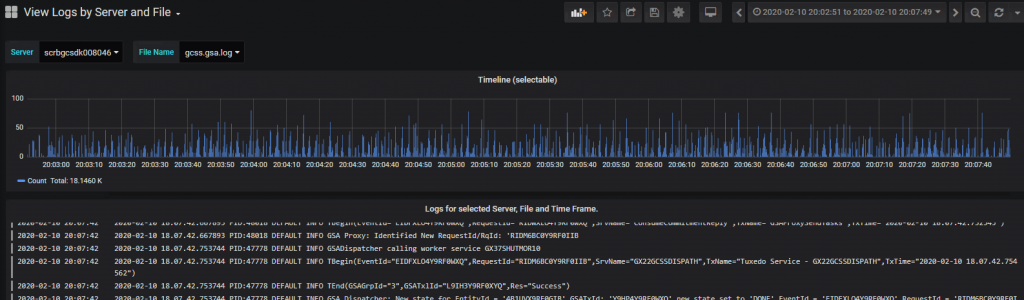
This dashboard allows you to quickly browse logs for a particular Server and File Name, just like looking at a log file. You can only select Server, File Name, and Time Range, there is no ability to search.
The following Filters are available out of the box:
Scroll up and down with a mouse wheel.
Note: If needed, extra drop-down Filters can be configured by request – for example, User, etc.
Time Range can be easily selected with either with Time Picker in the upper right corner or Timeline Panel. For details, see corresponding sections for the “Using Log Search Table Dashboard.”
Comments